Rising utility tariffs, expanding infrastructure demands, and tightening global sustainability mandates have forced Indian manufacturing units to fundamentally reassess their energy procurement strategies. In primary industrial corridors, commercial and industrial (C&I) grid tariffs frequently touch ₹8 to ₹12 per kilowatt-hour (kWh), directly impacting corporate operating margins. To protect capital efficiency, factories are turning to grid-interactive solar power as a structural hedge against utility inflation.
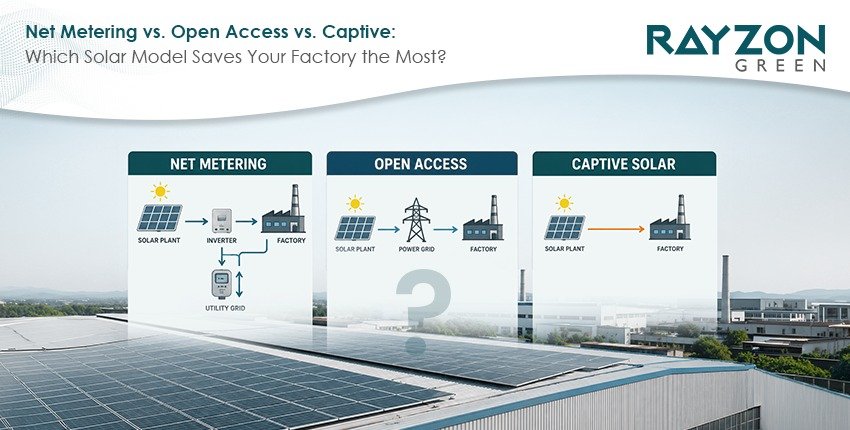
However, transitioning a factory to solar energy is not a one-size-fits-all endeavor. The financial and operational viability of a clean energy transition hinges on selecting the appropriate sourcing framework. The core decision-making process typically revolves around three primary pathways: rooftop solar with net metering, off-site open access, and captive or group captive power plants. This comprehensive analysis serves as a technical and commercial guide, analyzing the optimal model based on factory scale, regional tariff structures, and regulatory landscapes.
Sourcing clean power in India requires an understanding of how local grid connectivity, physical site limitations, and utility surcharges interact. When evaluating the strategic framework of net metering vs open access vs captive solar India, industrial energy managers must analyze the operational and legal parameters that govern each model.
Rooftop net metering represents the most direct, on-site solar deployment model. Photovoltaic arrays are installed directly on the factory's structural roof or within the immediate ground premises. The electricity generated during peak daylight hours is consumed instantaneously by the facility's active load—such as HVAC units, heavy motors, and assembly lines.
Any surplus energy not consumed by the factory is exported directly back to the local distribution company (DISCOM) grid.9 A bidirectional smart meter tracks both imported and exported energy, allowing the factory to receive utility credits that offset nighttime or off-peak grid consumption.
While rooftop net metering offers a low Levelized Cost of Energy (LCOE) and requires zero grid transmission fees, its primary bottleneck is physical scale. A high-load factory may consume millions of units annually but only possess enough shade-free roof area to support a system that offsets 10% to 15% of its total demand. Furthermore, state regulators enforce strict capacity limits on net metering, frequently capping on-site solar systems at 1 MW or the customer's sanctioned contract demand.
When on-site space is insufficient to meet a factory's massive energy requirements, Open Access (OA) solar bypasses physical spatial boundaries. Under this framework, a factory enters into a bilateral Power Purchase Agreement (PPA) with a private, utility-scale solar developer who operates a remote solar farm located hundreds of kilometers away. The generated green power is virtually transmitted to the factory through the existing high-voltage state or national transmission grid.
Open Access can be structured as either a short-term or long-term contract (typically 10 to 25 years), enabling a factory to offset up to 100% of its utility load without dedicating on-site physical space. However, transmitting electricity across long distances incurs grid fees payable to state utilities, including wheeling charges, transmission charges, and scheduling fees.
The most significant financial hurdle is the Cross-Subsidy Surcharge (CSS). The CSS is a regulatory penalty levied by local DISCOMs to compensate for the loss of high-paying industrial customers. Because state regulators can adjust the CSS upward at short notice, third-party Open Access models are exposed to tariff volatility that can erode projected financial savings.
The captive model is a legally defined ownership structure governed by the Indian Electricity Rules of 2005. In a single-user captive model, a large industrial corporation builds, owns, and operates an off-site solar farm, wheeling 100% of the generated power exclusively to its own factories.
For mid-to-large-scale manufacturers who prefer to avoid the high capital cost of owning an entire off-site plant, the Group Captive model operates as a co-investment consortium. Multiple distinct factories collectively invest in a Special Purpose Vehicle (SPV) that owns the solar asset. To qualify for captive status and protect the asset from regulatory penalties, the purchasing consortium must satisfy two strict statutory thresholds:
Meeting these legal thresholds exempts the factory from paying the Cross-Subsidy Surcharge (CSS).5 In high-tariff states, this CSS exemption reduces the landed cost of solar power by ₹1.50 to ₹2.50 per unit compared to third-party open access, providing long-term tariff predictability and an attractive return on investment.
|
Operational Variable |
Rooftop Net Metering |
Third-Party Open Access (OPEX) |
Captive / Group Captive |
|
Siting Architecture |
On-site (Factory roof or local ground-mount) |
Off-site (Remote utility-scale solar park) |
Off-site (Remote utility-scale solar park) |
|
Capacity Sizing Limits |
Restricted by roof area and DISCOM caps (typically 100 kW to 1 MW) |
Capped only by the factory's sanctioned contract demand |
Capped only by the factory's sanctioned contract demand |
|
Capital Sourcing |
High CAPEX (Self-owned) or OPEX (Rooftop PPA) |
Zero upfront capital; pure utility-style billing |
Moderate co-investment (26% equity share in SPV) |
|
Cross-Subsidy Surcharge |
Fully Exempt |
Applicable (Subject to unpredictable annual revisions) |
Fully Exempt (Statutory protection under Electricity Act) |
|
Asset O&M Operations |
Handled on-site by local plant operators |
Managed entirely by the third-party developer |
Managed by specialized, utility-scale solar park operators |
|
Regulatory Complexity |
Low; local DISCOM registration and meter installation |
Moderate; requires short-term or long-term grid open access approvals |
High; requires SPV corporate drafting, SHA, and annual equity audits |
The economic returns of any industrial solar project are determined by the utility tariffs of the state where the manufacturing facility operates. Gujarat and Maharashtra represent two of India’s most robust industrial zones, yet their regulatory approaches to billing, time-of-use adjustments, and grid banking differ significantly.
The Maharashtra Electricity Regulatory Commission (MERC) has implemented structural changes to manage peak grid demand. MERC enforces mandatory Time-of-Day (TOD) billing for all industrial and commercial consumers with a contracted demand of 10 kW and above.11 This system divides the 24-hour day into three distinct pricing periods:
Historically, factories used net metering to bank daytime solar credits (Zone 2) and offset expensive evening peak consumption (Zone 3). However, under revised same-slot banking regulations, solar credits generated during Zone 2 can only be used to offset grid consumption during those same daytime solar hours. They cannot be carried forward to offset Zone 3 evening bills. For factories running late afternoon or evening shifts, standard on-grid solar leaves their most expensive billing window completely untouched.
To address this challenge and stabilize the grid, Maharashtra enacted its landmark Renewable Energy and Storage Policy. Effective April 1, 2026, all new rooftop solar and open access projects above 100 kW must co-locate a Battery Energy Storage System (BESS).
The state policy enforces strict battery sizing criteria:
This mandate has transformed solar project economics. Solar energy generated during the day is diverted to charge modular Lithium Iron Phosphate (LFP) batteries. During the expensive evening shift (Zone 3), the battery discharges, allowing the factory to bypass the 20% peak grid surcharge and maximize savings. On the procurement front, MERC has also confirmed that industrial units can simultaneously use rooftop solar net metering alongside open access power, establishing a dual procurement pathway.
The Gujarat Electricity Regulatory Commission (GERC) has introduced the Distributed Renewable Energy Sources (DRES) Regulations, replacing its decade-old net metering rules.22 GERC provides five distinct billing options to accommodate different factory requirements 22:
While Gujarat's policy allows net metering up to 1 MW, most local DISCOMs (including UGVCL, DGVCL, MGVCL, and PGVCL) practically restrict net metering for High Tension (HT) industrial connections to 100 kW. Beyond 100 kW, factories are transitioned to a gross metering or net billing arrangement, which changes their return on investment.9
Additionally, GERC's framework introduces a storage-linked mandate. Any industrial prosumer with a contracted demand above 100 kW that installs a solar capacity exceeding its sanctioned load must integrate a BESS. The battery must support at least 2 hours of daily charging and discharging for a minimum of 50% of the excess solar capacity installed.
|
Tariff & Surcharge Parameters |
Maharashtra (MSEDCL Slabs) |
Gujarat (GUVNL Slabs) |
|
Average HT Industrial Grid Tariff |
High (₹10.71 to ₹10.88 / unit) |
Moderate-High (₹7.50 to ₹10.00 / unit) |
|
Peak Hour Tariffs (Zone 3) |
+20% Surcharge (5:00 PM to 12:00 AM) |
+45 Paise/unit peak surcharge during morning/evening peak hours |
|
Solar Hour Tariffs (Zone 2) |
15% to 25% Consumption Rebate |
60 Paise/unit consumption rebate (11:00 AM to 3:00 PM) |
|
State Cross-Subsidy Surcharge |
High (₹1.50 to ₹2.50 / unit) |
Moderate (₹1.29 / unit) |
|
Grid Energy Banking Window |
Restricted same-slot banking |
Carry forward as monetary credit; annual settlement at ₹2.25 - ₹2.50 / unit |
|
BESS Co-Location Mandate |
Mandatory for all new solar installations > 100 kW |
Mandatory only if solar capacity exceeds the sanctioned load |
|
Net Landed Solar Savings |
₹4.20 to ₹5.50 / unit (with BESS co-location) |
₹2.50 to ₹4.50 / unit (under net billing/captive models) |
The choice of solar model depends heavily on the factory's scale of energy consumption. By analyzing the specific needs of factories consuming 1 MW, 5 MW, and 20 MW+, industrial managers can select the configuration that maximizes financial savings.
A factory with a 1 MW peak power demand typically consumes between 1 million and 1.5 million electrical units annually, which is characteristic of medium-sized industrial plants.4 At this scale, the primary objective is to offset daytime baseline loads while managing regional net metering limits.
1 MW Factory Solar Configuration Sizing
Roof Capacity: ~300 kW to 500 kW (Provides on-site solar coverage)
Battery Storage (BESS): ~150 kW / 300 kWh (Required under Maharashtra policy)
Sourcing: Hybrid Rooftop + Group Captive SPV (Combines on-site with off-site share)
Because of on-site space constraints, the factory's rooftop can typically host a solar array ranging from 300 kW to 500 kW. In Gujarat, since the local DISCOM caps net metering for HT connections at 100 kW, the remaining generation is subject to net billing. In Maharashtra, the installation requires a co-located BESS. For a 300 kW solar array, the factory must install a minimum 150 kW / 300 kWh battery storage system.
By storing daytime solar energy and discharging it during the evening peak-hour shift, the factory avoids the 20% TOD surcharge. For any remaining energy deficit, the factory can purchase a small, 500 kW share in a local Group Captive SPV to offset its total utility bill without committing significant capital.
Factories with a 5 MW load—such as automotive ancillary units, large textile mills, and pharmaceutical packaging plants—consume approximately 6 million to 8 million units annually.8 At this scale, the physical rooftop is a major bottleneck. A typical 8,000 square meter factory roof can only support a 1 MWp solar array, which covers just 12% to 15% of the annual electricity requirements.
The Group Captive model represents the most financially optimized pathway at this scale.5 Instead of relying on a limited rooftop system, the factory partners with a utility-scale solar park developer to secure a 3 MW to 4 MW off-site solar capacity share.4 By investing ₹40 Lakhs to ₹50 Lakhs per MW to acquire a 26% equity stake in the SPV, the factory qualifies for captive status and is completely exempt from the state's Cross-Subsidy Surcharge (CSS).5
This exemption reduces the landed cost of off-site solar power to approximately ₹4.50 to ₹5.50 per unit, compared to ₹8.50 to ₹11.00 per unit for grid power.2 This configuration generates over ₹1.5 Crore in annual operational savings, allowing the factory to recover its upfront co-investment in less than 12 months.2
Mega-scale manufacturing operations—such as heavy engineering works, cement plants, steel mills, and hyperscale data centers—consume tens of millions of units annually.12 For these large-scale operations, on-site rooftop solar is virtually irrelevant, meeting less than 5% of their total energy requirements.12
To achieve deep decarbonization and maximize cost savings, these enterprises construct dedicated, off-site captive solar farms under a 100% equity model.2 If the factory is located in a state with high local utility surcharges or low solar irradiation, it can leverage Interstate Transmission System (ISTS) Open Access.8
This allows the factory to wheel solar power directly from high-irradiation, low-cost regions like Rajasthan.8 By purchasing power from a remote solar farm, the enterprise leverages the CERC transmission charge waiver for renewable energy.8
To optimize these multi-megawatt off-site plants, the enterprise utilizes high-wattage, bankable bifacial TOPCon modules (up to 720W of output).13 These advanced panels capture reflected light on both sides and operate with higher temperature stability, lowering the Levelized Cost of Energy (LCOE) and delivering long-term tariff protection.7
The capital cost of solar technology in India varies based on project scale, with larger installations benefiting from procurement efficiencies :
|
System Sizing Capacity |
Average Cost per Watt-peak (Wp) |
Total Estimated Capital Cost |
|
Up to 200 kW |
₹40 / Wp |
₹0.80 Crore |
|
Up to 500 kW |
₹38 / Wp |
₹1.90 Crore |
|
Up to 1 MW (1,000 kW) |
₹36 / Wp |
₹3.60 Crore |
|
Up to 2 MW |
₹34 / Wp |
₹6.80 Crore |
|
5 MW and Above |
₹32 / Wp |
₹16.00 Crore+ |
To illustrate these financial dynamics, let us evaluate a medium-sized textile factory located in an active industrial cluster.4
The table below illustrates the projected financial outcomes of four distinct procurement choices :
|
Sourcing Parameters |
Option A: Status Quo (100% Grid Power) |
Option B: 100 kW Rooftop Net Metering (CAPEX) |
Option C: 1.5 MW Third-Party Open Access (OPEX) |
Option D: 1.5 MW Group Captive Share (Co-Investment) |
|
Solar Sourced Annually |
0 units |
1.5 Lakh units |
22 Lakh units |
22 Lakh units |
|
Basic Solar Tariff ( |
N/A |
N/A (Self-owned) |
₹3.80 / unit |
₹3.50 / unit |
|
Grid Fees & CSS |
N/A |
None |
₹3.20 / unit |
₹1.50 / unit (CSS Exempt) |
|
Landed Cost of Power |
₹8.50 / unit |
₹3.50 / unit (Amortized LCOE) |
₹7.00 / unit |
₹5.00 / unit |
|
Net Savings per Unit |
₹0.00 |
₹5.00 / unit |
₹1.50 / unit |
₹3.50 / unit |
|
Upfront Equity Required |
Zero |
₹40 Lakhs |
Zero 2 |
₹45 Lakhs (SPV share) |
|
Annual Financial Savings |
Zero |
₹7.50 Lakhs |
₹33.00 Lakhs |
₹77.00 Lakhs |
|
Capital Payback Period |
N/A |
5.3 Years |
Immediate (PPA model) |
Under 12 Months> |
While Option B (Rooftop Net Metering) offers the cheapest power per unit, its total savings are severely limited by the physical rooftop area, offsetting only 3.1% of the factory's total annual energy bill.
Option C (Third-Party Open Access) provides a zero-CAPEX alternative, but the addition of the cross-subsidy surcharge (CSS) increases the landed cost to ₹7.00 per unit, limiting annual savings.
Option D (Group Captive) emerges as the most financially optimized pathway. By making a co-investment of ₹45 Lakhs to acquire a 26% equity stake in a shared off-site solar farm, the factory gains CSS exemption under the law.5 This lowers the landed solar tariff to ₹5.00 per unit, generating ₹77 Lakhs in annual savings and fully recovering the upfront equity investment in less than a year.
Implementing a grid-interactive industrial solar asset requires expert engineering, procurement efficiency, and proactive system maintenance. Rayzon Green, the specialized Solar EPC subsidiary of Rayzon Solar, manages every phase of these industrial deployments.
The heart of any industrial solar project is its photovoltaic technology. Rayzon Solar's massive manufacturing capacity (which stands at 11.3 GW in 2026) produces high-efficiency N-type TOPCon (Tunnel Oxide Passivated Contact) and Mono PERC modules.
Industrial developers prefer Rayzon’s bifacial modules, which generate electricity from both sides of the panel, for several reasons :
Rayzon Green manages the entire project lifecycle, ensuring factories do not have to coordinate between multiple state departments, equipment vendors, and construction crews :
Selecting the appropriate solar model requires a step-by-step assessment of a factory's physical constraints, state regulations, and financial goals :
A factory should begin by calculating its shade-free rooftop area. If the roof can accommodate a system that offsets at least 50% of the factory's peak demand, a self-owned rooftop solar system with net metering is the most cost-effective option, offering the lowest landed cost per unit. However, if the roof space is limited or restricted by DISCOM caps (such as the 100 kW cap for HT consumers in Gujarat), the factory must look to off-site models.
By matching these operational parameters with state policy requirements and partnering with a tier-1 solar EPC provider like Rayzon Green, industrial facilities can secure reliable, low-cost green power, insulate their business from future tariff hikes, and improve their long-term operating margins.
As India accelerates toward its massive clean energy and grid-stability targets, factories can no longer afford to treat solar procurement as a secondary sustainability goal. Choosing between Rooftop Net Metering, third-party Open Access, and Captive/Group Captive models is a multi-million-rupee decision that directly dictates your operational profitability for the next two decades.
While on-site rooftop net metering provides the absolute lowest Levelized Cost of Energy (LCOE), its real-world application is severely restricted by physical roof space and DISCOM-enforced limits. Third-party Open Access offers scale with zero capital commitment but exposes factories to unpredictable state-level Cross-Subsidy Surcharges (CSS) that can erase projected savings. Consequently, the Group Captive model represents the most robust financial compromise for high-load factories—leveraging co-investment to legally bypass the CSS and secure long-term tariff predictability.
 )
)